
Five new organisational shapes have been proposed in the past eighteen months. They contradict each other and not one of them has looked at your organisation’s hiring, promotion, movement and exit data.
Many HR leaders I have spoken with have been told their organisation is about to change shape. The pyramid is finished. Something else is coming, but nobody agrees on what that looks like.
In the past eighteen months the profession has been offered five new shapes: the diamond, the hourglass, the K, the pod and the circle. They are not variations on one idea. Two of them, the hourglass and the diamond, look at the same layer of the organisation and recommend opposite things.
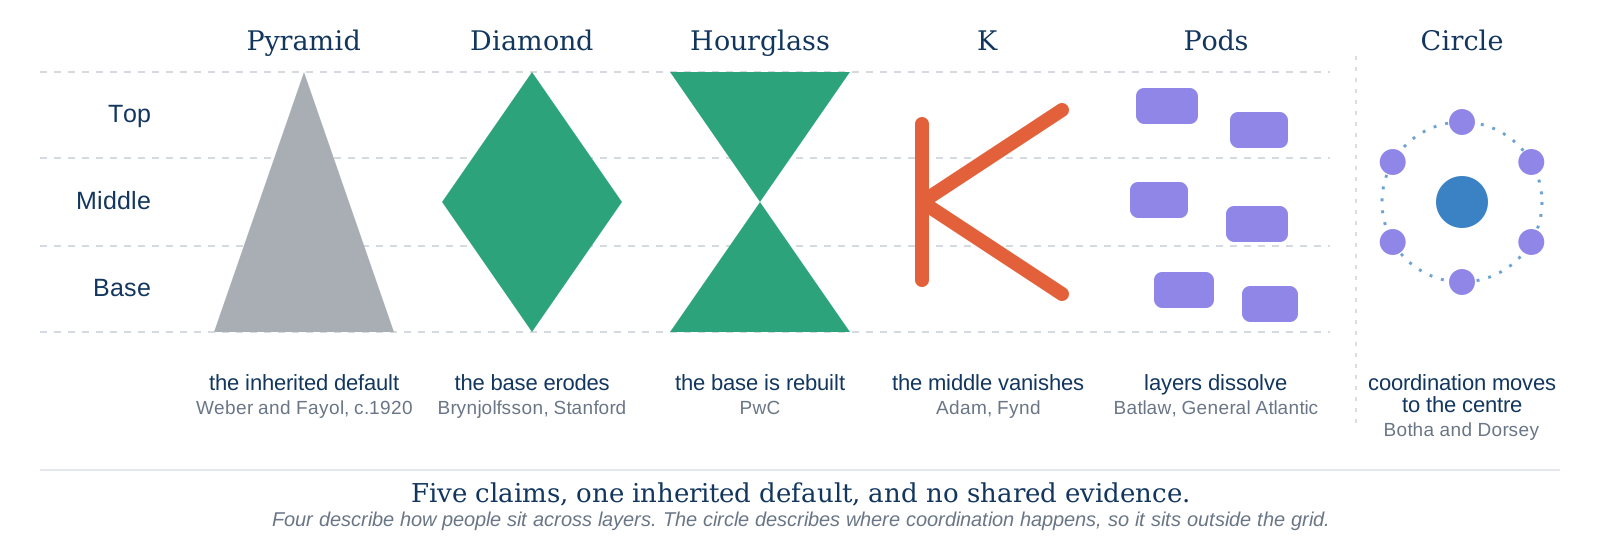
The five claims. Four of them describe how people sit across the layers of an organisation. The circle describes where coordination happens, so it sits outside that grid.
Two other terms circulate alongside these shapes and are often mistaken for organisational shapes. T-shaped describes how deep one person’s expertise runs. The J-curve describes how returns arrive after an investment. Both are useful ideas, but neither is a claim about the shape of an organisation.
What none of the five organisational shapes does is look at your hiring, promotion, movement and exit data.
That matters, because organisational shapes are not really designed. They are the accumulated result of many decisions about who to hire, promote, move and let go. Think of it like a landform: it is not designed, it is what remains after water has run across ground for a long time. An organisation’s shape forms the same way.
This is why I think shapes are the wrong thing to focus on. What matters is measuring the four decisions underneath them: buy, promote, move and retain. These are the levers you actually control. Each of the five shapes is really a prediction about what those four levers will do to your organisation – and a prediction can be tested.
There is now a fifth question sitting alongside them, and it’s the one that makes the others hard to read: what shape is an organisation when some of the work is no longer done by a human at all?
Below, I have set out each claim, who is making it, what the evidence shows, and which lever it bears on.
The diamond: the base erodes

The claim is that AI absorbs entry-level work, so organisations stop hiring at the bottom. The wide base of the pyramid thins, and the shape bulges in the middle.
This has the strongest evidence of the five. Erik Brynjolfsson, a Stanford economist, working with Bharat Chandar and Ruyu Chen, tracked monthly payroll records from ADP, the largest payroll processor in the United States.
In the occupations most exposed to AI, employment for workers aged 22 to 25 fell by 13 per cent relative to other age groups. A later revision put the figure at 16 per cent. The direction has held as the data has deepened, which matters more than the exact number.
Brynjolfsson then asks the question the shape cannot answer. If nobody enters at the bottom, where do your middle managers come from in ten years?
Entry-level hiring is the easiest line to pause when a cost target lands, and the consequence does not appear for years. That delay has a name, which I will come to shortly.
What to measure:
Buy. Measure your entry-level external hires this year against three years ago, and assess whether the change was a decision somebody made or a consequence nobody priced.
The hourglass: the base is rebuilt

This is the opposite instruction for the same layer. Keep the base wide, but fill it with people who can work with AI from the start and contribute at a higher level sooner.
PwC set this out in January 2026. It describes the diamond as the shape organisations drift into by default rather than by choice, and argues against it. It also says it is building the hourglass inside its own firm, which is worth knowing when weighing the advice.
This is the sharpest disagreement in the conversation. Two credible sources, same layer, opposite advice.
There is a catch the hourglass case does not address. A wide base of AI-literate generalists ramps quickly into breadth. Depth is different. It comes from doing the same work repeatedly, handling the routine case badly, then adequately, then well, until judgement forms.
That’s precisely the work AI is absorbing. Breadth can be accelerated. I have not yet seen evidence that depth can be, and depth is what lets someone decide, a decade later, whether the machine is wrong.
What to measure:
Buy again, but read differently. Measure not only how many people you hired at entry level, but what those people actually get to practise, and whether anyone is still doing the repetitive work that builds judgement.
The K and the circle: the middle disappears

These two claims say the middle layer goes. One asserts it. The other explains why.
The K comes from Farooq Adam, founder of the Indian retail technology company Fynd.
In this shape, a small group pulls away permanently, the middle disappears and no reskilling closes the gap. It’s an opinion rather than a research-backed insight. The K shape is borrowed from pandemic-era economics, where a K-shaped recovery described two groups separating and never reconverging.
The supporting evidence is mixed. Gartner predicted in October 2024 that through 2026, one in five organisations would use AI to remove more than half of their middle management roles. That window closes this year, so the prediction is now checkable.
Less often repeated is the warning in Gartner’s own paper that mentoring and development pathways may break as a result. What are we actually willing to sacrifice in our future pipeline?
The circle is the more interesting version. Roelof Botha of Sequoia Capital and Jack Dorsey, chief executive of Block, set it out in March 2026. The organisation stops being a stack of layers and becomes a centre with people around it, where the centre is a system holding the current state of the business.

Theirs is the only one of the five shapes that explains why the middle would go, rather than simply predicting it will.
Management layers exist largely to carry information up and instructions down, and every layer loses something in the retelling. If a system holds that state directly, the relay job disappears, and so does the reason the layer existed.
There are two cautions worth noting here. Fintech company Block cut close to 40 per cent of its workforce in February 2026 on this logic, but an announcement made in February tells us the decision was taken, not that it worked. And Dorsey is both Block’s chief executive and co-author of the argument explaining why it should work.
Removing layers also removes named owners. If an AI system influences a decision, someone still has to own that decision, with a review threshold and a record of what happened.
What to measure:
Promote and retain. Measure how many of your middle roles are filled from within rather than hired in, and note where your regretted exits cluster.
The pod: layers dissolve

Here there is no fixed shape at all. Small teams form around an outcome, direct a set of AI agents and disband when the work is finished.
The case is made by Anish Batlaw, Global Head of Talent at the growth investor General Atlantic. His central example is Kiwi.com, a European travel technology company that rebuilt itself this way and reported lower costs and higher revenue. General Atlantic owns Kiwi.com. That does not make the results untrue, but it’s worth noting that the case and the investor are the same party.
The pod is also the oldest idea here, and the evidence against it is better than the evidence for it.
Amazon ran small autonomous teams for years. Two long-serving Amazon executives, Colin Bryar and Bill Carr, have since written that team size was not the variable that mattered, and that the model did not last. What endured was giving each piece of work one named owner.
That’s worth sitting with. The organisation that ran this experiment longest concluded that the pod was not the point. The ownership was.
For HR the question is not whether pods work. It’s where a career lives inside one. If a team is long-lived, people enter it, learn from those around them and progress inside it. If teams constantly form and dissolve, there is no apprenticeship left.
What to measure:
Move. Review how many people moved sideways rather than upward last year, and whether your teams last long enough for anyone to learn inside them.
“I think shapes are the wrong thing to focus on. What matters is measuring the four decisions underneath them: buy, promote, move and retain. “
Pipeline debt
There’s a cost to getting the entry-level base wrong, and it behaves like technical debt.
If you stop hiring at entry level to meet a cost target, the savings are immediate and visible. The interest accrues quietly. The principal falls due in five to seven years, when the middle cannot be filled from below and every competitor is buying senior talent in the same market at the same moment.
Three of the sources above describe this without naming it, and none of them owns it. More often than not, it falls to the people function to fix, years after the decisions that caused it were made by someone solving a different problem.
Read your own shape first
All five claims can be tested against data you already hold. The method is called internal labour market analysis. It has been used since the 1970s, and the version most practitioners recognise was published by Mercer in 2004.
It works like this. Take your levels, executive down to the front line. For each level, count four things across the past three to five years:
- How many came in from outside?
- How many were promoted from the level below?
- How many moved sideways?
- How many left?
Those are your four levers.
You may know the sourcing version of this as build, buy, borrow and bot. That describes where capacity comes from. These four describe how it moves once it arrives, which is what determines your organisational shape.
There is one warning about this method that is worth flagging. It was built when all capacity was human, and it still counts only people. If agents absorb work at the base, your headcount falls while the work still gets done, and the data shows you a shrinking base without telling you why.
So add a fifth column at every level: what has happened to the work itself. Some of it has been absorbed entirely. Some of it is still done by a person, but with a machine doing the first pass. Some of it has not moved at all. Without that column you will read an automation decision as a hiring decision, and fix the wrong thing.
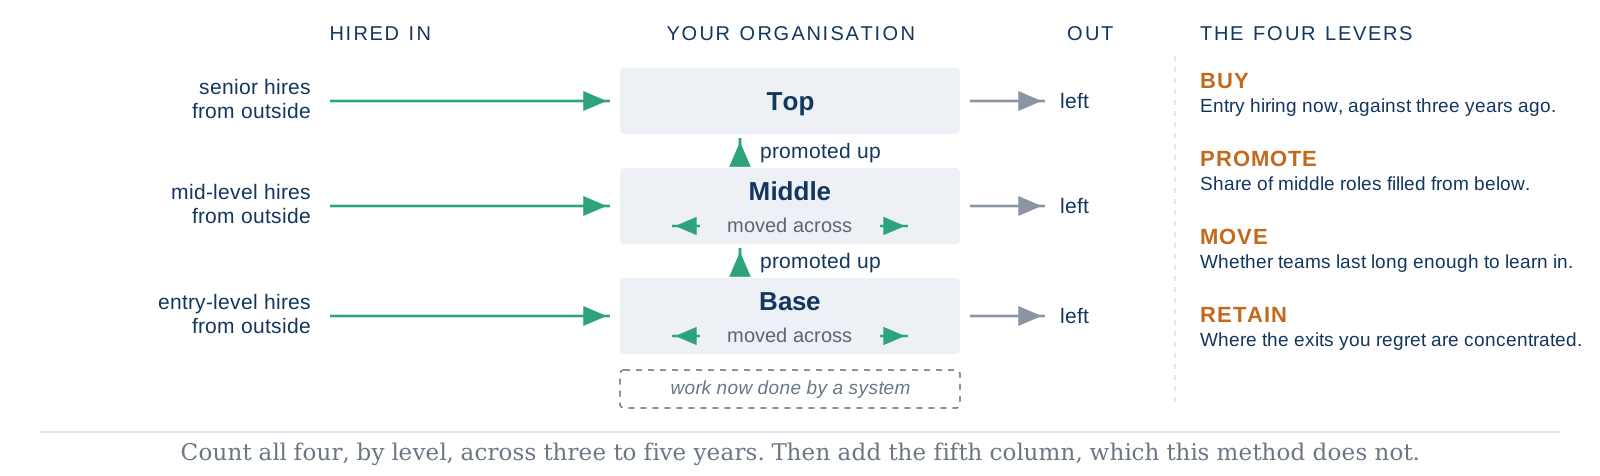
Four counts, by level, over three to five years. The fifth column, what has happened to the work itself, is the one the method was never built to capture.
In one large Australian financial services organisation, the work did not begin with a cost target. It began with AI, and what it would do to customer-facing work. Leadership already had an instinct about structure. The organisation was too hierarchical, and the answer was something closer to an hourglass, with fewer middle managers and more people near the customer.
Nobody needed a diagnostic to tell them they were a pyramid. They knew. The question was what to become, so we ran the analysis across one customer-facing area first.
It showed three things at once. External hiring was concentrated at senior levels. Promotion into the middle was weak, and the career paths that should have produced it were invisible to the people standing in them. Retention of critical talent was exposed.
Underneath sat something more basic. A single customer-facing role carried dozens of different job descriptions, with no clear distinction between levels. Promotion cannot show up in your data when there is nothing legible to be promoted between.
What followed was not a new org chart. It was a program to simplify the role architecture, then redesign the workflow. The shape came last.
“For HR the question is not whether pods work. It’s where a career lives inside one. If a team is long-lived, people enter it, learn from those around them and progress inside it. If teams constantly form and dissolve, there is no apprenticeship left.”
Five questions worth answering honestly
You will not decide whether your organisation becomes a diamond, an hourglass or something without a name. That is being decided quarter by quarter, in decisions made for reasons that often have nothing to do with organisational design.
But if you want a better sense of the direction your organisation is heading in, ask these questions:
- How does your entry-level hiring compare with three years ago, and was that change a decision somebody made or something that simply happened?
- What share of your middle roles were filled from below?
- Do your teams last long enough for anyone to build depth inside them?
- If your five most critical people left tomorrow, would your data have shown it coming?
- How much of the work at each level is now done by a system?
A landform can be read long before it is finished. That is the value of looking at how people move rather than at the formal org chart. If you can answer those five questions early, you still have time to change the shape
🧰 HR’s career resource toolkit
- Toolkit: AHRI’s Workforce Planning toolkit
- Podcast: Redesigning work in the age of AI with Professor Sharon Parker
- Course: Gain a better understanding of your people data with AHRI’s foundations and advanced-level people analytics course.
Dr Philip Gibbs MAHRI is CEO and Founding Partner of AESP & Gibbs Pty Ltd and Co-Founder of Agile HR Analytics. A chartered psychologist, he has spent over two decades at the intersection of data, technology and human behaviour. Former Executive, People Analytics at NAB; Head of Workforce Analytics at CBA; Director of Organisation and People Analytics at GSK. The thinking, frameworks and arguments in this article are my own. I used Claude by Anthropic as a writing and structuring aid, and to check sources against the primary record.
Sources
- Brynjolfsson, E., Chandar, B. and Chen, R., “Canaries in the Coal Mine? Six Facts about the Recent Employment Effects of Artificial Intelligence,” Stanford Digital Economy Lab, 2025, revised 2026. digitaleconomy.stanford.edu
- PwC, “Agentic AI workforce redesign,” 29 January 2026. pwc.com
- Adam, F., “The K-Shaped Organisation: The Rise of the 100x Super Employee,” People Matters, 2026. peoplematters.in
- Gartner, “Top Predictions for IT Organizations and Users in 2025 and Beyond,” 22 October 2024. gartner.com
- Amazon internal directive on the individual contributor to manager ratio, September 2024, reported by Business Insider and Fortune.
- Batlaw, A., “AI Is Killing the Century-Old Organizational Pyramid,” General Atlantic, May 2026. generalatlantic.com
- Bryar, C. and Carr, B., Working Backwards: Insights, Stories, and Secrets from Inside Amazon, 2021.
- Botha, R. and Dorsey, J., “From hierarchy to intelligence,” Sequoia Capital, 31 March 2026. sequoiacap.com
- Lin, A., “AI Organizations Without Managers: When Hierarchy Becomes Obsolete,” UNU Macau blog, 24 June 2026. Views are the author’s own. unu.edu
- Nalbantian, H., Guzzo, R., Kieffer, D. and Doyle, J., Play to Your Strengths: Managing Your Internal Labor Markets for Lasting Competitive Advantage, McGraw-Hill, 2004. The concept of the internal labour market originates with Doeringer, P. and Piore, M., 1971.


